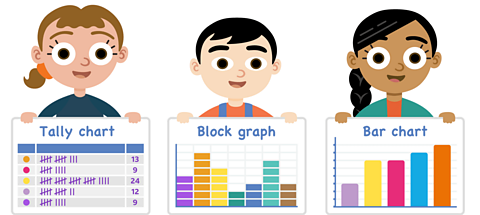
What is data?
Data means information. You can collect data and show it in tables, charts or graphs.
It will make the information easier to read and understand.
Make sure you read all the different parts of the table, chart or graph to understand what it is showing.
Quiz: What is data?
Why not see how much you know about this topic already? Then work through the page and see if you can beat your score.
Tally marks
You can use tally marks when you collect data.
Every 5 marks is grouped to make it easy to count in 5s.
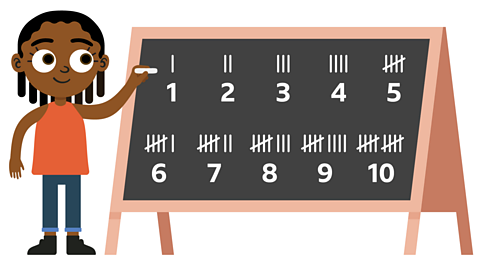
You make each group by drawing 4 lines down and then the fifth line is a slash across the group. This makes 5 marks in total.
Tally charts
A tally chart uses tally marks to show data.
This tally chart shows you the favourite fruit of a group of children.
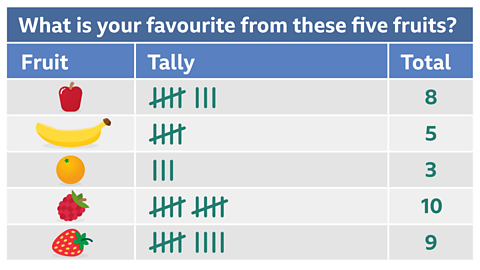
A tally mark is used to record the choice of each child.
When you add up the number of tally marks in each row, you find they total for each type of fruit.
Block graphs
A block graph shows data using blocks.
Let's look at the data for favourite fruit again, but this time in a block graph.
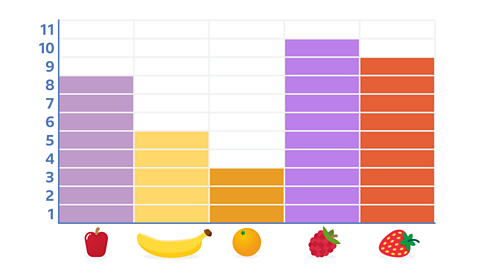
Each block on the graph represents the favourite fruit of one child. You can use the numbers on the left of the graph to work out the total for each fruit.
You can also compare the number of blocks on the graphs.
For example, let's find out how many more children like raspberries than oranges.
Firstly, let's find out how many children like raspberries.
There are 10 blocks in this column, so 10 children chose raspberries.
Now, how many children chose oranges? There are 3 blocks for oranges.
You need to find how many more children like raspberries than oranges, so you need to find the difference between these two numbers.
10 - 3 = 7
So, 7 more children chose raspberries than oranges.
Bar charts
A bar chart is like a block graph, but it shows information using a bar.
Let's look at the same data one more time, but this time in a bar graph.
What is the same and what is different?
When you look at a bar chart remember to:
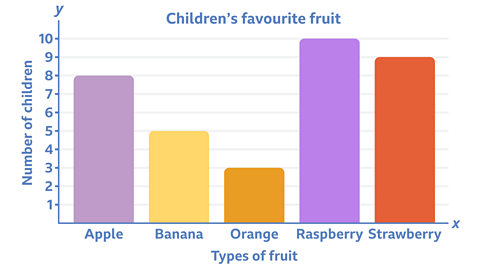
Look at the title first. This bar chart is all about children’s favourite fruit.
Look at the numbers and labels. Each bar has a label to show the type of fruit and the numbers show how many children chose each fruit.
Look at the height of each bar. They show the number of children that chose each fruit.
Example 1
This tally chart shows how many of each type of drink were sold from a market stall.
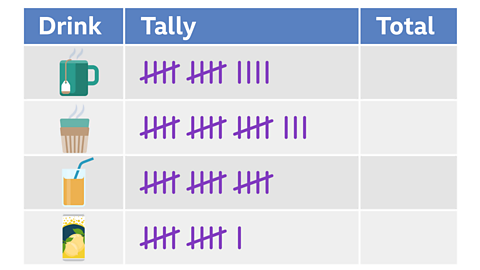
Can you count the tally marks to work out how many of each type of drink were sold?
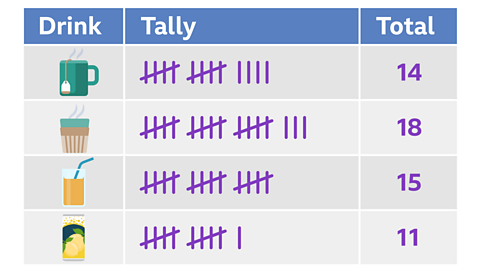
✓ Let's complete the table by adding up all the tally marks in each row.
Tally marks are recorded in groups of five, so knowing how to count in 5s can be useful when reading a tally chart.
Example 2
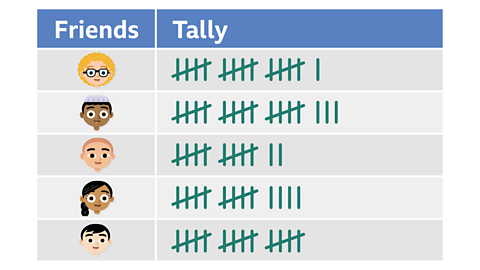
A group of five friends want to test their catching skills. They take turns to catch a ball 20 times.
Here are the results in a tally chart.
You can put the result into a bar chart to make the results easier to read.
Look at the bar chart.
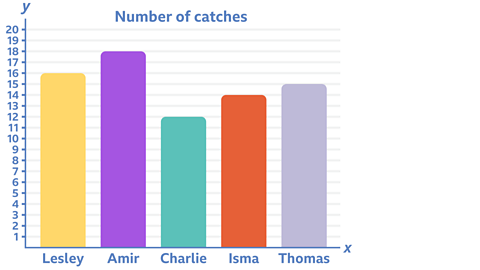
How many more catches did Amir make than Charlie?
✓ Amir caught the ball 18 times and Charlie caught the ball 12 times.
18 – 12 = 6
So Amir made 6 more catches than Charlie.
BBC Bitesize newsletter. External Link
Sign up to our BBC Bitesize newsletter to receive monthly news, stories and updates on latest Bitesize content.

More on Handling data
Find out more by working through a topic
- count6 of 6
- count1 of 6

- count2 of 6

- count3 of 6