What is a data table?
A data table is a table that is used to display information about different things.
It can show pictures (in a pictogram), a tally or numbers.
The title of the table tells you what the table is about.
The headings tell you what data is in each column or row.
Rows go across and columns go up and down.
Activity: How to read a data table
Complete this interactive activity to understand how to read a data table. Then put your knowledge to the test.
Reading information on a data table
A data table helps you see information clearly. It shows you how many things have been counted in different categories.
You can use them to compare data and numbers.
The information is organised in rows and columns. Rows go across, and columns go up and down.
In a data table, the first column shows the categories, or options, to choose from.
The second column shows how many of that option were counted.
This data table shows children's favourite colours.
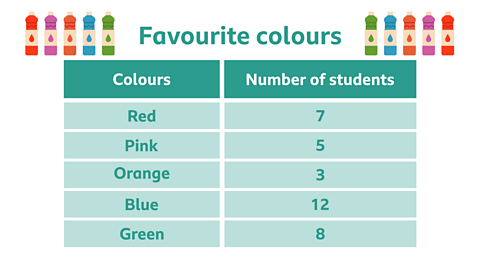
The most popular colour is blue, as 12 children picked this.
The least popular colour is orange, as only 3 children picked this.
To work out how many children are represented in this table, you can add up all of the numbers in the second column.
7 + 5 + 3 + 12 + 8 = 35
How to calculate tallies
Tally marks are used to count things. You can add them up to find totals.
Each group of 5 tallies represents 5 items.
Any tally marks not in a group of 5 represent 1 item each.
To find the total number, you add up all the tally marks.
For example, if there are two groups of 5 tallies and 2 extra tally marks, the total is 10 + 2 = 12.

Example 1
Look at this data table. Its title is 'Favourite pets in Year 2'.
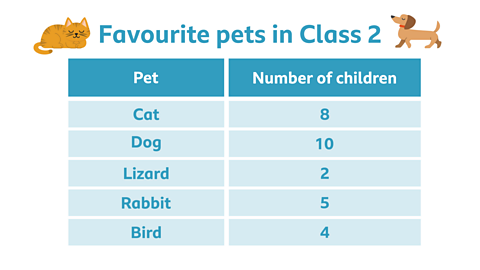
What is the most popular pet in Class 2?
What is the least popular pet in Class 2?
✓ Dogs are the most popular pet in Class 2.
10 children chose dogs and this is the greatest number in the data table.
Lizards are the least popular pet in year.
Only 2 children chose lizards and this is the smallest number in the data table.
Example 2
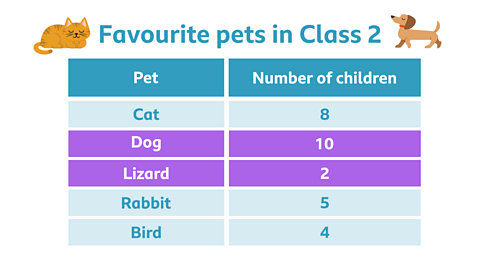
Look at this data table. Its title is 'Favourite sports in Class 2'.
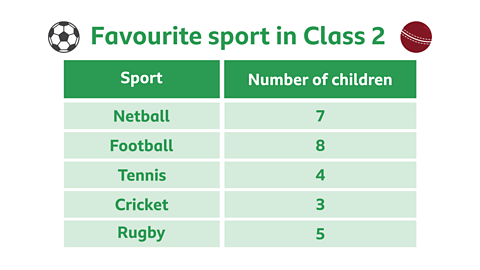
How many children in total are shown in this data table?
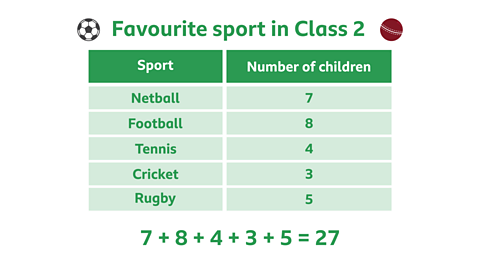
✓ The answer is 27 children.
To work it out add all of the numbers together.
7 + 8 + 4 + 3 + 5 = 27
Example 3
Lily asked all the people on her street what their eye colour was. She recorded the information in a data table.
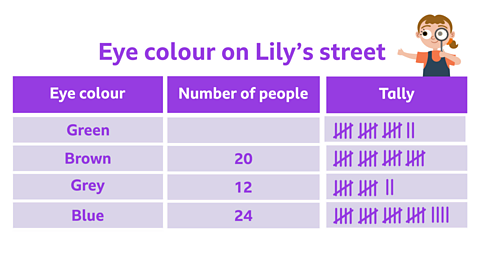
Can you count the tallies to work out the missing number?
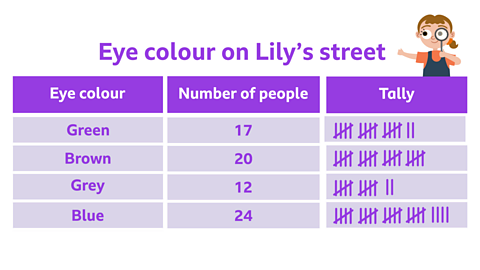
✓ The answer is 17.
There are three tallies of 5, which equals 15 and then 2 more.
15 + 2 = 17
BBC Bitesize newsletter. External Link
Sign up to our BBC Bitesize newsletter to receive monthly news, stories and updates on latest Bitesize content.

More on Measurements
Find out more by working through a topic
- count1 of 7

- count2 of 7

- count3 of 7

- count4 of 7