Speaker 1: Within the business I use averages everyday.
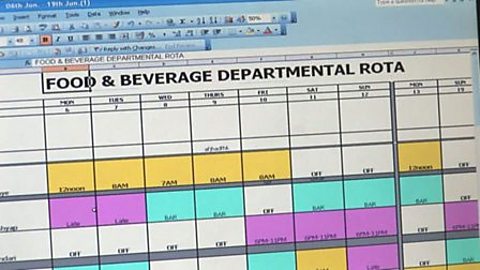
I tally up the average of clients coming in daily, weekly, monthly so that I can compare what months maybe I need to do a promotion in and what months I don't.
Speaker 2: It's not just about making the most amount of money overall but it's also about how much we make on average per room.
If we sold 100 rooms and we made £20,000 for that night, the way we would calculate our average room rate is we would divide that 20,000 by the 100 rooms and it would give us an average rate of £200 per room.
It maybe worth selling the rooms slightly cheaper to be slightly fuller and that obviously also has a knock on effect for our other areas of the business because if we can have people here, they'll go and use other areas of the hotel.
To find an average of a set of numbers, add them all up and divide by the total amount of numbers. The range is the difference between the largest and the smallest numbers in the set. They are useful in sports.
Quick tips for tutors
Averages and range includes:
- Explanation of range and the different types of average
- Worked examples of the process for calculating the arithmetic mean, median and mode
- Activities to practise extracting information from tables, charts and diagrams to calculate range and average.
Downloadable Factsheets
Entry 1 & 2 - Price range
An introduction to price ranges.

Entry 1 & 2 - What is average?
An introduction to averages.

Level 1 - Understanding decimal answers
Summary of how some averages may be fractions or parts of a whole number.

Level 1 - Averages glossary
Summary of some of the key words used in discussion of averages.

Level 1 - Understanding distorted averages
Summary of how an average can sometimes give a misleading impression of a situation by distorting values.

Level 1 - Understanding averages
Summary of what an average is, how to calculate it and the contexts in which it used.

Level 1 - Calculating the mean
How to work out the mean value of a set of figures by adding, totalling and then dividing, with examples.

Level 1 - Calculating the range
How to work out range, the difference between the highest and lowest values in a set of data, with examples.

Level 1 / 2 - Calculating the mode
How to work out the mode, the most common item in a set of data, with examples.

Level 1 / 2 - Calculating the median
How to work out the median, the middle value of a set of data when the figures are written in order, with examples.

Level 1 / 2 - Comparing mean, median and mode
How to analyse data effectively by comparing the results derived from calculating mean, median and mode.

Downloadable Worksheets
Entry 3 - Finding totals from tables and charts
Exercise in identifying totals by pairing calculations with data from tables and charts.

Entry 3 - Organising and comparing data
Exercise in sorting data from a chart and calculating the difference between highest and lowest numbers.

Level 1 - Calculating averages
Exercise in working out averages by adding and then dividing.

Level 1 - Calculating ranges and averages: Problems
Exercise in working out ranges and averages in word problems using whole numbers, decimals and percentages.

Level 1 - Calculating averages: Problems
Exercise in working out averages in different units of measurement.

Level 1 - Shopping problems 1
Exercise in working out averages for household shopping bills.

Level 1 - Calculating ranges and averages
Exercise in working out ranges and averages using whole numbers and decimals.


