Key points about straight line graphs

Coordinates such as (3, 8) have an 𝑥-coordinate (3) and 𝑦-coordinate (8) to show how far a point has moved horizontally and vertically from the The point (0,0) on a set of axes. It is the point where the 𝑥-axis and 𝑦-axis meet. .
Straight line graphs are represented by A mathematical statement showing that two expressions are equal. The expressions are linked with the symbol =. such as 𝑥 = 2, 𝑦 = 3𝑥 + 7 or 𝑥 + 2y = 10. The 𝑥 and 𝑦 A quantity that can take on a range of values, often represented by a letter, eg 𝑛, 𝑥, 𝑦, 𝑧, 𝑡 … etc. in the equation relate to the 𝑥 and 𝑦 coordinates.
To help draw a straight line graph from its equation, fill in a table of 𝑥 and 𝑦 values. Plot the pairs of values as coordinates and join to make a line.
Make sure you are confident with substituting values into expressions and solving equations to understand how to plot straight line graphs.
Video – Straight line graphs
Watch this video to find out how the equation 𝑦 = 𝑚𝑥 + 𝑐 can be used to work out the gradient and 𝑦-intercept on a straight line graph.
Straight line graphs.
All straight line graphs have an equation that can be written in the form 𝑦 equals 𝑚𝑥 add 𝑐, where 𝑚, the coefficient of the 𝑥 term, is the gradient or slope of the line. The constant, 𝑐, is the 𝑦-intercept. This is the value where the line crosses the 𝑦-axis.
Let's look at an example question.
A straight line passes through the points (1, 5) and (3, –1). Find the equation of this line.
First, draw a sketch to help make sure your answers are sensible. This doesn't need to be accurate, but you should mark the two given points in roughly the right positions, in the correct quadrants.
Remember, the first coordinate represents movement along the 𝑥-axis, left or right, and the second coordinate represents movement along the 𝑦-axis, up or down.
To finish the sketch, draw a straight line that goes through each of the points and the 𝑦-axis.
Then, you need to find two pieces of information, the gradient, 𝑚, and the 𝑦-intercept, 𝑐.
To find the gradient, you need to calculate the change in 𝑦 divided by the change in 𝑥.
It can be helpful to label the two points as A and B here.
The change in 𝑦 is given by the 𝑦 coordinate of point B, 𝑦B, subtract the 𝑦 coordinate of A, 𝑦A. Then, the change in 𝑥 is given by the 𝑥 coordinate of point B, 𝑥B subtract the 𝑥 coordinate of A, 𝑥A.
It doesn't matter which way round you label the points. You'll get the same answer if you chose to subtract the coordinates of point B from the coordinates of point A.
Labelling (1, 5) as point A and (3, –1) as point B, and using 𝑦B subtract 𝑦A over 𝑥B subtract 𝑥A, this gives a change in 𝑦 of –1 subtract 5, and a change in 𝑥 of 3 subtract 1.
Simplified, this is –6 divided by 2, which equals –3. So, the gradient, 𝑚, equals –3.
You can substitute this into the general equation for a straight line, 𝑦 equals –3𝑥 add 𝑐.
Now you've worked out the gradient, don't forget to check your answer makes sense.
The sketch shows that the 𝑦 value decreases as the 𝑥 value increases, meaning the line slopes downhill from left to right. This means the gradient is negative, which matches the calculated gradient of –3.
Next, to find the 𝑦-intercept, 𝑐, choose one of the given points, for example (1, 5), and then substitute 𝑥 equals 1 and 𝑦 equals 5 into the line’s equation, with the variable 𝑐 staying unknown for now. Doing this gives 5 equals –3 times 1 add 𝑐, which simplifies to 5 equals –3 add 𝑐.
Finally, solve this equation for 𝑐 so that you have all the information needed to find the equation of the line. So, add 3 to both sides to isolate 𝑐 on the right-hand side.
5 add 3 equals 8, so 𝑐 equals 8 and the equation of the line is 𝑦 equals –3𝑥 add 8.
To check, look at your sketch. The line crosses the 𝑦-axis at a positive 𝑦-value that's greater than 5, so 8 is a realistic answer for the 𝑦-intercept.
Check your understanding
Plotting straight line graphs
Coordinates are points that are written in the form (𝑥, 𝑦). They can be plotted on a set of Two reference lines, one horizontal (the 𝑥 axis) and one vertical (the 𝑦 axis) that cross at right-angles on a grid. Axes is the plural of axis. where (0, 0) is the The point (0,0) on a set of axes. It is the point where the 𝑥-axis and 𝑦-axis meet. .
Some straight line graphs are represented by equations with one , such as 𝑥 = 3 or 𝑦 = 1. Their graphs are either The up-down direction. or The left-right direction. .
A straight line graph with two variables is represented by an equation such as 𝑦 = 3𝑥 – 7. The equation shows the link between the 𝑥 and 𝑦-coordinates.
To plot a graph from its equation, substitute different values of 𝑥 into the equation to give the corresponding 𝑦-coordinates. The pairs of 𝑥 and 𝑦 values can be recorded in a table.
Follow the working out below
GCSE exam-style questions
- Complete the table for 𝑦 = 3𝑥 − 2.
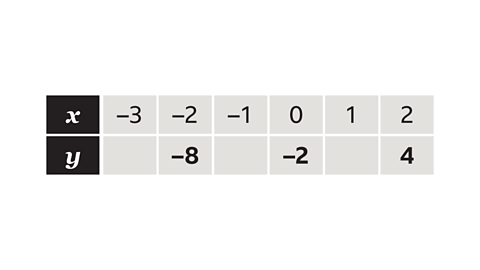
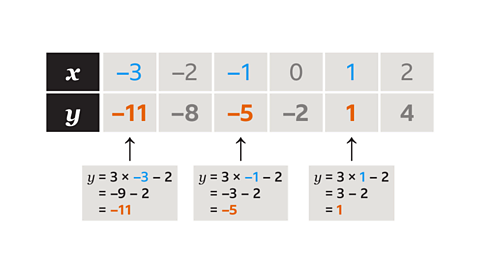
Substitute each 𝑥 value into the expression 3𝑥 − 2.
- When 𝑥 = −3, 𝑦 = −11.
- When 𝑥 = −1, 𝑦 = −5.
- When 𝑥 = 1, 𝑦 = 1.
- Use the table of values to write five coordinates that would exist on the line 𝑦 = 3𝑥 − 2.
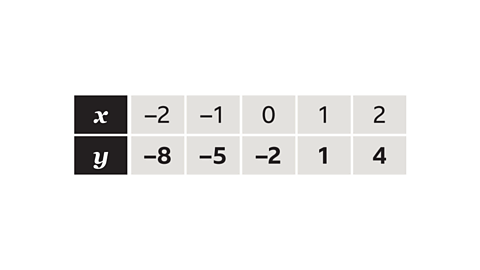
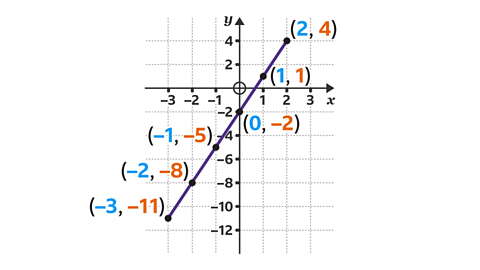
Each column of the table represents a set of coordinates to plot.
Eg, the first column represents the coordinates (– 2, –8).
Plotting more complex straight line graphs
The equations of some straight line graphs contain a negative of 𝑥, such as 𝑦 = 5 − 3𝑥.
When filling in a table of values for 𝑥 and 𝑦, the of 𝑥 values leads to calculations with negative numbers.

Remember:
Subtracting a negative value gives the same result as adding. For example:
3 − −2
= 3 + 2
= 5
To draw the equation of a line that does not begin with “𝑦 =”, such as in the example 2𝑥 + 3𝑦 = 12, the table of values can be reduced to two pairs of values.
One set of values is the point where 𝑥 = 0, and the other is where 𝑦 = 0.
To draw the equation of the line, plot these two points on a set of axes and draw a line between them.
Follow the working out below
GCSE exam-style questions
- Complete the table for 𝑦 = 5 − 3𝑥.
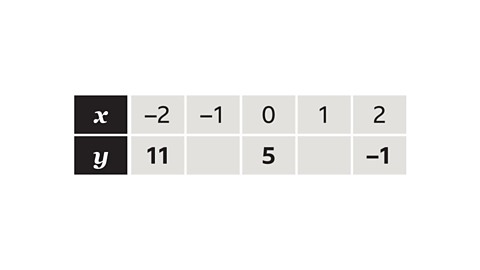
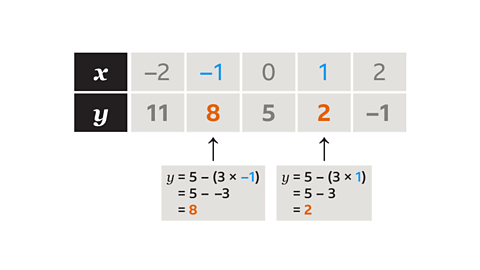
Substitute each 𝑥 value into the expression 𝑦 = 5 − 3𝑥.
- When 𝑥 = −1, 𝑦 = 8.
- When 𝑥 = 1, 𝑦 = 2.
- At which two coordinates would the line 𝑥 − 2𝑦 = 4 cross the 𝑥 and 𝑦-axis?
(4, 0) and (0, −2)
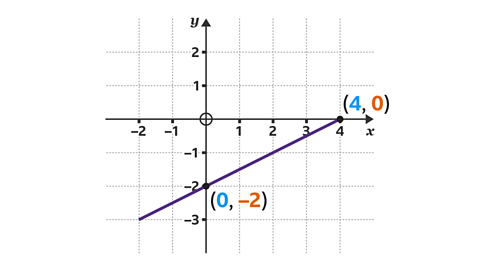
The line crosses the 𝑥-axis when 𝑦 = 0. Substitute 0 in place of 𝑦 in the equation 𝑥 − 2𝑦 = 4, then solve to find 𝑥:
- 𝑥 − 2 × 0 = 4
- 𝑥 = 4
The coordinate is (4, 0).
The line crosses the 𝑦-axis when 𝑥 = 0. Substitute 0 in place of 𝑥 in the equation 𝑥 − 2𝑦 = 4, then solve to find 𝑦:
- 0 − 2𝑦 = 4
- −2𝑦 = 4
- 𝑦 = −2
The coordinate is (0, −2).
Note that the two coordinates could be plotted and joined to draw the line 𝑥 − 2𝑦 = 4.
Quiz – Plotting straight line graphs
Practise what you have learned about plotting straight line graphs with this quiz.
Now that you have revised how to plot straight line graphs, why not try taking a look at equations of parallel and perpendicular lines?
More on Algebra
Find out more by working through a topic
- count14 of 14
- count2 of 14