Key points
A collection of facts or observations about something. can be represented in many ways. Two-way tables are a common representation of data as they are easy to read and show the The number of times something occurs. of two Things which can take different a value..
In two-way tables, the rows represent one variable, and the columns represent another. Each One space in a table or grid. represents the frequency of data points that fit both variables.
Using two-way tables
A two-way table shows the frequency of data which satisfies two variables.
Each row represents one variable, and each column represents another. To read them, the cell which sits between the two will have the frequency of data points that fit both variables.
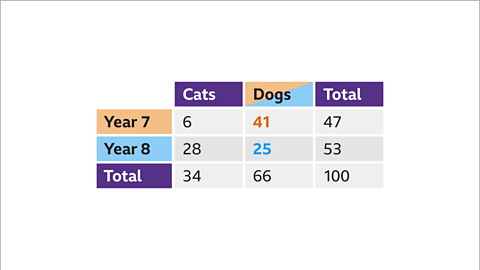
This two-way table summarises data collected about age and whether someone is left or right-handed.
- To find the number of 12-year-olds who are right-handed in this two-way table, look for the cell which sits on the row for '12-year-olds' and in the column for 'right-handed':
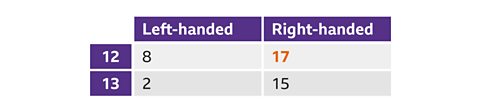
The frequencies show that 17 of the 12-year-olds are right-handed.
Examples
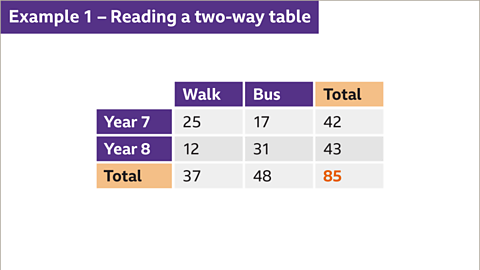
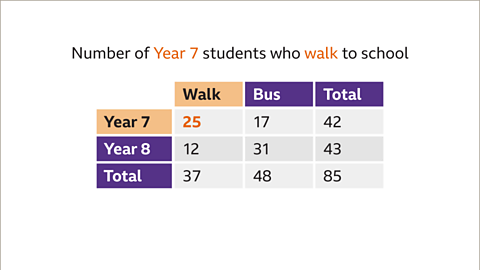
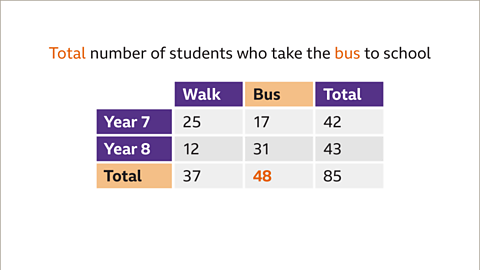
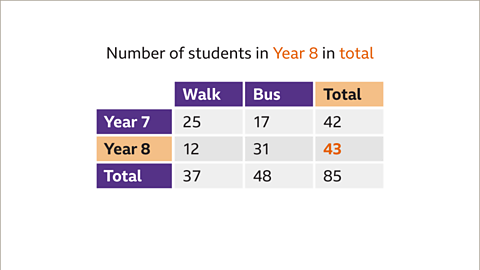
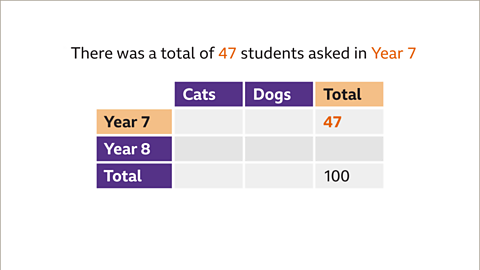
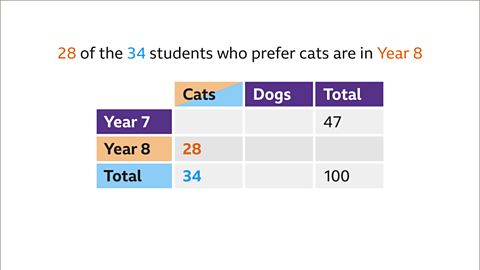
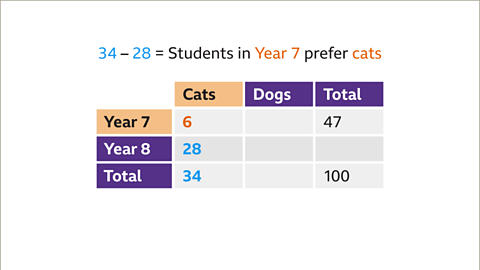
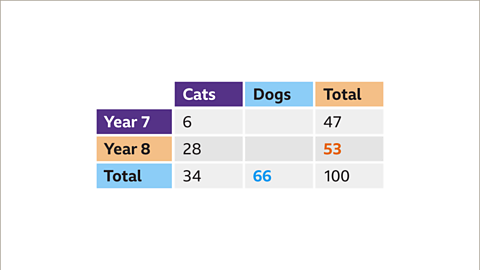
Image caption, 85 students were asked how they get to school. The results are shown in this two-way table.
1 of 10
Question
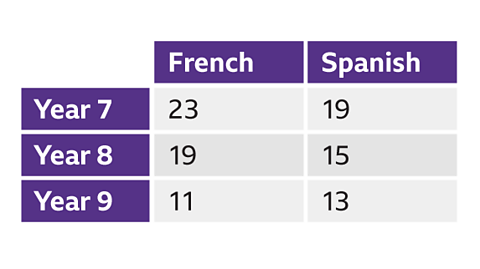
60 sports fans in two different towns were asked if they preferred football or rugby.
How many fans from Town 2 prefer rugby?

3 sports fans from Town 2 prefer rugby.
Look across the row for 'Town 2' and down the column for 'Rugby'. Where they meet is the cell containing the answer.

Practise using two-way tables
Quiz
Practise interpreting two-way tables and using a two-way table to record information with this quiz. You may need a pen and paper to help you with your answers.
Real-life maths
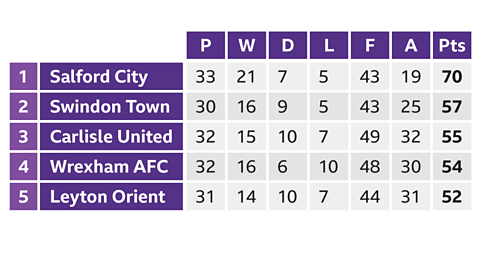
In sport, the position of different teams are sorted into a two-way table according to their success rate and other facts about their overall performance.
For example, football league tables are two-way tables in which each row represents a team, and each column represents different statistics about that team. This could be the total points scored or the number of games played, for example.
Two-way tables are used for this as they can show a large amount of information at once, which is easy to read and understand.
Game - Divided Islands
Play the Divided Islands game! game
Using your maths skills, help to build bridges and bring light back to the islands in this free game from BBC Bitesize.

More on Collecting and recording data
Find out more by working through a topic
- count3 of 4
- count4 of 4
- count1 of 4