Key points
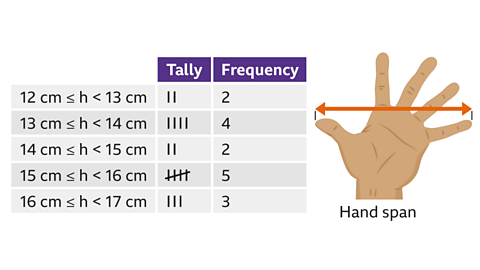
- A collection of facts or observations about something. can be represented in many ways. Stem and leaf diagrams are a common representation of data as they are easy to read and show the shape of the data, as well as grouping the data into classes.
- It is useful to see the shape of the data to see whether the data is When data is not symmetrical and has more pieces of data at one end of the range. or if the data is Each group has the same number of values or the data is evenly spread out..
- If there is a The group which contains the most pieces of data. this can be clearly seen from a stem and leaf diagram.
- Stem and leaf diagrams present the data in an ordered list to make it clearer to read, and easier to work out the highest and lowest values in the dataset.
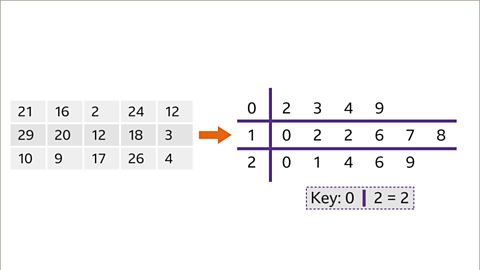
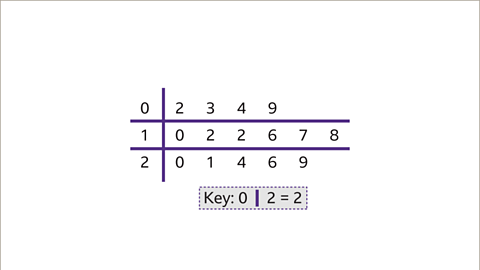
- There must always be a key. The key tells the user how to interpret the diagram.
Using a Stem and leaf diagram
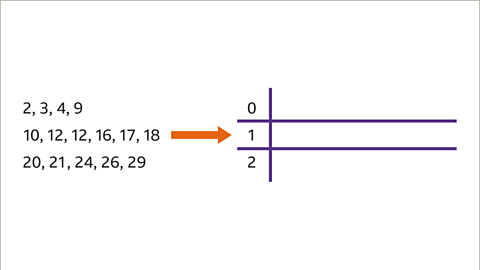
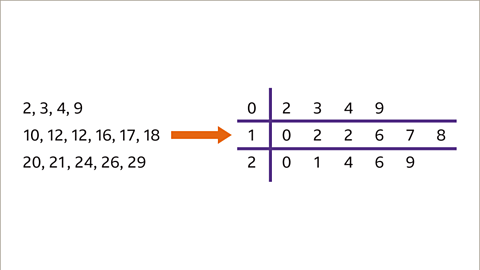
- Stem and leaf diagrams are formed by splitting the number into two parts, the ‘stem’ and the ‘leaf. For example:
- In the number 36, the tens would form the stem and the units the leaf.
- In the number 2.1, the units would form the stem and the tenths the leaf.
- The numbers are usually written in Increasing in size. order, so the row
2 | 1 3 4 4 5 7
shows the numbers 21, 23, 24, 24, 25 and 27 in order.
- As the data is in order, it is easy to work out the highest value, lowest value and the A type of average calculated by finding the middle value of a set of numbers in ascending order. If there are two middle numbers, the median is the mean of those two numbers. of the data.
- Stem and leaf diagrams must always have a key which explains how to read the data.
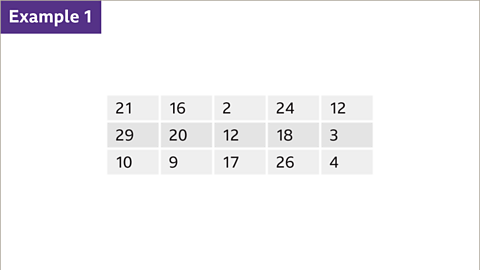
Examples
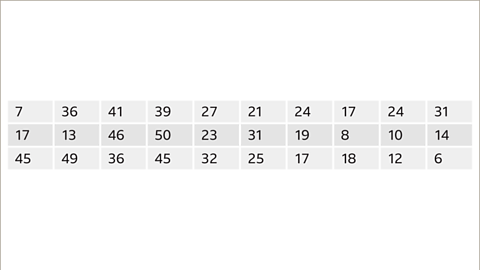
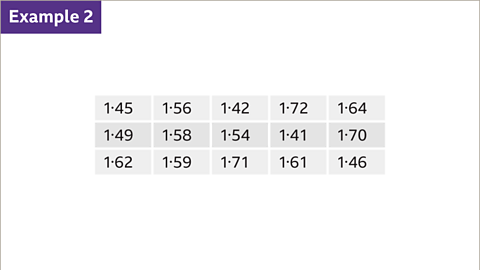
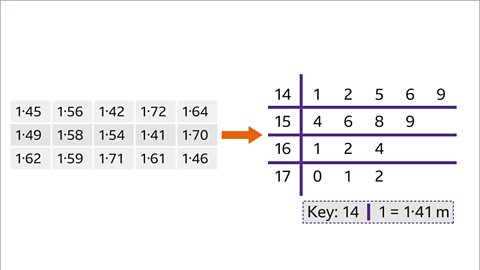
Image caption, A maths test is marked out of 50. The marks awarded to different students are shown in this table. This is difficult to interpret. It is not in order, and it is hard to see the highest or lowest score.


1 of 10
Question
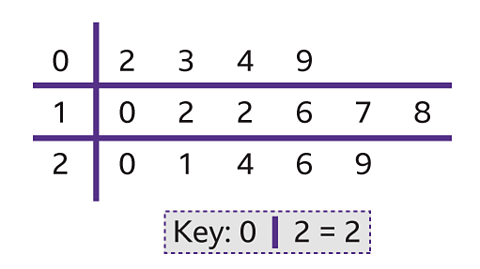
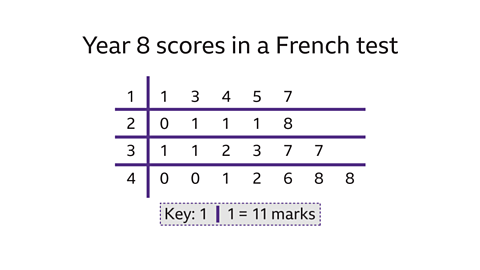
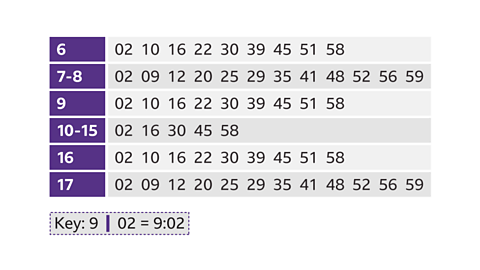
Using the stem and leaf diagram, work out:
- How many people got 31 marks
- The modal score
- The median score
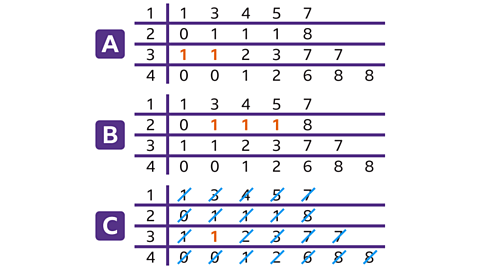
- There are two 1s on the ‘3’ stem row. Therefore, two people scored 31 marks.
- There are three 1s on the ‘2’ stem row. This is the most common value on a row. Therefore, the modal score was 21 marks.
- There are 23 pieces of data, the median will be the middle piece of data which is the 12th data item. This is 31, therefore the median score was 31 marks.
Practise stem and leaf diagrams
Quiz
Practise interpreting stem and leaf diagrams with this quiz. You may need a pen and paper to help you with your answers.
Real-life maths
Stem and leaf diagrams can be used to make public transport timetables easier to read.
They reduce the amount of text that is needed to share information about train and bus times.
Game - Divided Islands
Play the Divided Islands game! game
Using your maths skills, help to build bridges and bring light back to the islands in this free game from BBC Bitesize.

More on Collecting and recording data
Find out more by working through a topic
- count1 of 4
- count2 of 4
- count3 of 4