Key points about graphs of inequalities

Show values that satisfy an inequality on a set of axes by drawing the line of the corresponding equation and shading the area specified in a question.
Include a dashed line for inequalities where the sign < or > is used and a solid line for inequalities where the sign ≤ or ≥ is used.
By combining different regions, it is possible to show a single region that satisfies more than one inequality.
Make sure you can plot graphs of linear equations and recognise the equation of a line from a graph before looking at graphs of inequalities.
Video – Graphs of inequalities
Watch this video to find out how to solve inequality problems on a graph and the importance of drawing straight or dashed lines to represent inequalities.
Graphs of inequalities – Higher tier
Inequalities look like equations, but they have an inequality symbol instead of an equals sign. This indicates the variable which can be any letter, / can take a range of values.
You can show inequalities on a graph just like you can with equations like 𝑦 equals 𝑥. At every point on this line, 𝑦 equals 𝑥.
What about 𝑦 is less than or equal to 𝑥?
𝑦 is less than 𝑥 at every point below this line. For example, the point (7, 5) satisfies the inequality because the 𝑦 coordinate, 5, is less than the 𝑥 coordinate, 7.
You can show this by shading out the entire region above the line, leaving only the correct area. Here, we're shading out the regions we don't need, but in other questions you may be asked to shade the region the inequality is describing.
The inequality is also true on the line because 𝑦 is less than or equal to 𝑥. For example, the point (2, 2) satisfies the inequality because the 𝑥 coordinate 2 equals the 𝑦 coordinate 2. This is shown by drawing a solid line.
It's really important to label the region satisfied by each inequality drawn on a graph. For the inequality 𝑦 is less than 𝑥, a dashed line shows that the points on the line are not included.
Let's try using this method to answer this question: on the grid, identify the region represented by the inequalities 𝑥 is greater than 1, 𝑦 is less than 8, and 𝑥 add 𝑦 is greater than or equal to 8. Label the region R.
Starting with 𝑥 is greater than 1, replace the inequality with an equals sign in order to draw the straight line. 𝑥 equals 1 means the 𝑥 coordinate on this line will always be 1 no matter what the 𝑦 coordinate is.
But be careful! '𝑥 is greater than 1' means 𝑥 cannot equal 1 exactly, so you need to use a dashed line.
Now work out which side of the line satisfies the inequality.
If you're unsure, choose some random points either side of the line. The 𝑥 coordinate here is 4, which is greater than 1, so this side is correct. The 𝑥 coordinate here is 0, which is less than 1, so this side is incorrect. So, shade out the left-hand side of the line and then label the area on the right as ‘𝑥 is greater than 1’.
For the inequality 𝑦 is less than 8. First, draw the straight line 𝑦 equals 8, where every point on the line has a 𝑦 co-ordinate of 8. ‘Less than’ means the line isn't included in the solution, so make this a dashed line. This time, the region below the line satisfies the inequality, so you can shade out the region above.
And for the final inequality, 𝑥 add 𝑦 is greater than or equal to 8, swap in an equals sign as usual.
This one is a bit trickier.
One method we can use to sketch the line is making 𝑦 the subject. So first, rearrange the equation by subtracting 𝑥 from both sides, giving 𝑦 equals 8 subtract 𝑥, or 𝑦 equals –𝑥 add 8.
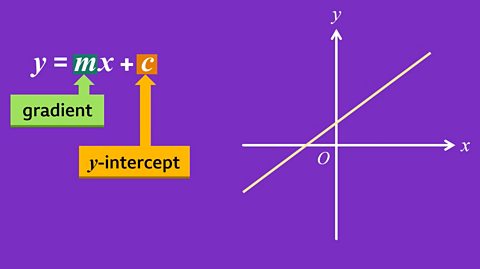
Now that 𝑦 is the subject, you can use the general equation for a straight line, 𝑦 equals 𝑚 𝑥 add 𝑐, to find the gradient and the 𝑦 -intercept. 𝑚 is the gradient, so this is –1, and 𝑐 is the 𝑦 -intercept, so this is 8 on the 𝑦 -axis, giving this line, which is solid as the inequality is ‘greater than or equal to’.
Finally, to find the region that satisfies the inequality, pick a random point such as (10, 0) and then substitute the 𝑥 and 𝑦 values into the inequality.
8 subtract 10 is –2 and 0 is greater than –2, so this point does satisfy the inequality, and you can shade out the other side of the line.
All points within the unshaded area, and on this section of the solid line, satisfy all three inequalities, so label this region R.
Check your understanding
Graphs of inequalities
Look at the following examples to understand how to represent different inequalities as graphs.

Remember
Questions can vary in how the required region needs to be shown, so make sure you follow the instructions for labelling and shading carefully.
GCSE exam-style questions
- What inequality is represented by the region R?
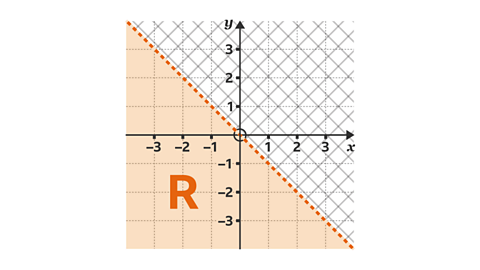
The region shows 𝑦 < –𝑥.
The line is made up of points where the 𝑦-coordinate is the negative value of the 𝑥-coordinate, eg (3, –3). In other words, 𝑦 = –𝑥.
The region, 𝑅, shows all the values where the 𝑦-coordinate is always less than negative 𝑥.
The line is dashed so 𝑦 cannot equal –𝑥.
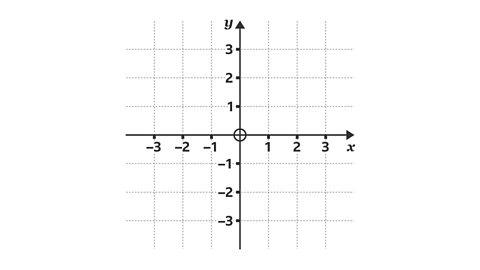
- Show the region that satisfies the inequality –2 < 𝑦 ≤ 1. Label the region R.
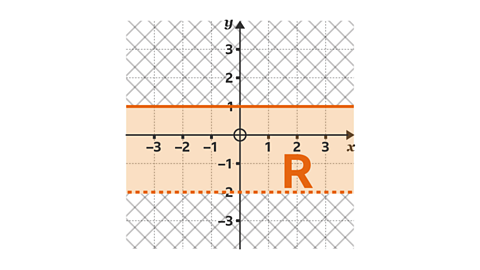
The 𝑦 values in the region are between 2 and 1.
𝑦 cannot be equal to –2, therefore a dashed line is drawn at 𝑦 = –2.
𝑦 can equal 1, so a solid line is drawn at 1.
The region is the area between the two lines.
- What three inequalities are represented by the region R?
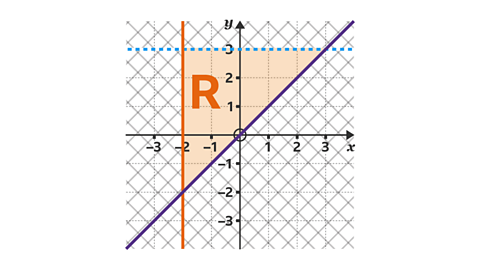
𝑥 ≥ –2, 𝑦 < 3 and 𝑦 ≥ 𝑥
The region to the right of the orange line shows 𝑥-coordinates greater than –2. The line is solid, so 𝑥 can equal –2. This inequality is 𝑥 ≥ –2.
The region under the blue line shows 𝑦-coordinates less than 3. The line is dashed, so 𝑦 cannot equal 3. This inequality is 𝑦 < 3.
The purple line shows the line 𝑦 = 𝑥. The region above the purple line shows all the points where the 𝑦-coordinate is greater than the 𝑥-coordinate, e.g. (1, 2). The line is solid, so 𝑦 can equal 𝑥. This inequality is 𝑦 ≥ 𝑥.
- Label the region, R, that satisfies the inequalities 𝑥 > 0, 𝑦 > 2, and 𝑦 > 2𝑥 – 1.
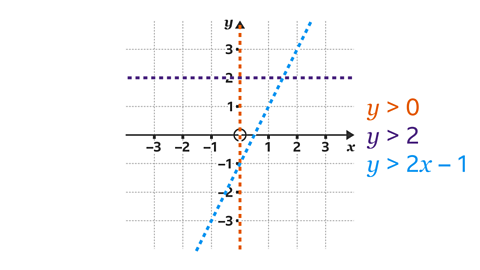
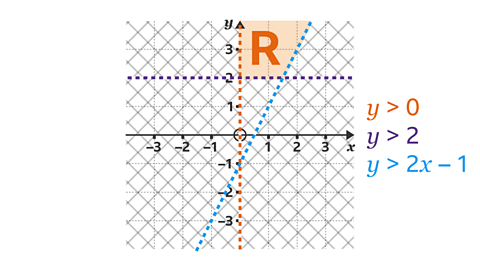
𝑥 > 0. The region must show points where the 𝑥-coordinate is greater than 0. This is to the right of the orange line.
𝑦 > 2. The region must show points where the 𝑦-coordinate is greater than 2. This is above the purple line.
𝑦 > 2𝑥 – 1
- To decide which side of the blue line is needed, choose a point on one side of the line - for example substitute the 𝑥 and 𝑦 value of (1, 3) into 𝑦 > 2𝑥 – 1.
- 3 > 2 × 1 – 1. This gives 3 > 1, which is true. The region is the side of the line that contains (1, 3).
Label the region R.
Higher – Quiz – Graphs of inequalities
Practise what you have learned about graphs of inequalities with this quiz for Higher tier.
Now that you have revised graphs of inequalities, why not try looking at Equations of parallel and perpendicular lines?
More on Algebra
Find out more by working through a topic
- count10 of 14

- count11 of 14
- count12 of 14